
In the summer of 2020, all over the country, nursing homes, schools, employers, and other ‘non-traditional’ sites outside of the healthcare industry began conducting COVID-19 testing on site. States required that all COVID-19 test results be reported, but these ‘non-traditional’ settings lacked automated ways to do so. Results were being reported through manual methods, such as fax, phone calls, manual data entry into a reporting portal, or CSV files, and as a result public health departments began seeing an increase in data quality problems.
To solve the data quality problem for public health departments, we first needed to solve the problems of testing sites. We built SimpleReport to support their testing workflow and make it easy to report high-quality data in real-time
In the summer of 2020 I was part of a team at USDS that was tasked by the White House Coronavirus Taskforce to uncover challenges within the COVID-19 data collection and reporting pipeline. We conducted dozens of contextual interviews and in-person observations with the CDC, state & local public health departments, testing sites, labs, and more.
While traditional healthcare providers such as clinics, hospitals, and laboratories had their own pain points, there was a big market gap for test sites outside of the traditional healthcare settings who were using rapid tests.
Rapid tests were becoming a popular tool for a variety of non-healthcare settings such as schools, nursing homes, correctional facilities, and more in order to screen staff, visitors, residents, and guests and safely operate. These tests had key advantages over traditional lab-based tests because they cost less and provided results on the spot in as little as 10 minutes.
These non-traditional testing sites were new to this type of testing, and did not have digital tools to manage patient data or their testing workflow. Instead, they generally relied on paper. People getting tested would fill out a form with their information, and the result would be marked on the form when it was ready. All testing sites were legally mandated to report both positive and negative results to their state (and sometimes also local) public health department. Results were being reported through manual methods, such as fax, physical mail, phone calls, manual data entry into a web form, or CSV file. This was taking hours per day away from people who did not have the time to spare.
Data received by public health departments was often:
I created an initial design concept based on what we learned in discovery, and rapidly iterated based on feedback observations of testing sites during a 1 week on-site in Pima County, Arizona—the location of our first pilot partner.
Using the U.S. Web Design System (USWDS) component library as a base, I was able rapidly create a high fidelity end-to-end prototype. This was initially built using Sketch but later transitioned to Figma.
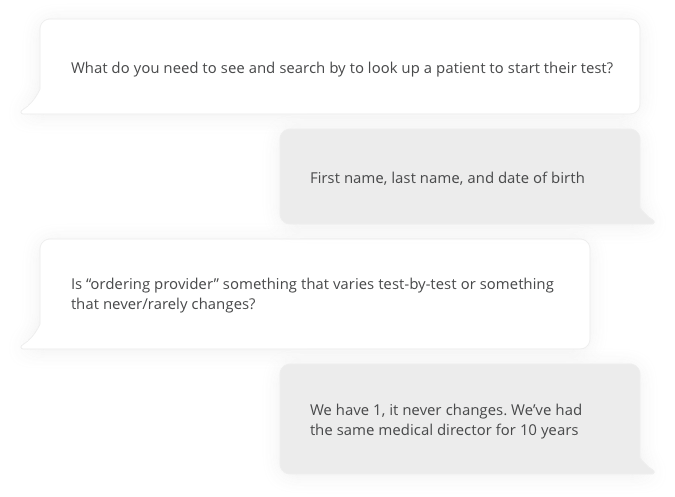
A fellow designer and I conducted 4 interviews with people at COVID-19 test sites and people at a local public health department .
We started by asking background questions to gain a deeper understanding of their current processes.
Next, we walked participants through the prototype, asking targeted questions while still allowing for open-ended feedback. The goal at this stage was not to evaluate the UI/UX but rather to evaluate whether the design met their data reporting requirements and whether they felt it would streamline their workflow.

The team needed to work quickly due to the pressing need during this phase of the pandemic, so developers began working in parallel to the ongoing design and research. Once there was a functional front-end demo built, I partnered with a fellow designer to run usability tests. We recruited 7 participants who were involved in conducting and reporting rapid test results.
Participants were asked to complete several tasks in the application while we observed. The goal was to evaluate whether the it was intuitive to use without any guidance. After going through all the tasks, we asked participants to share additional feedback. Designs were then updated and additional recommendations were added to the product backlog based on results of the testing.
The product MVP was launched with 1 pilot partner 2 months after initial concepts. After launch, the product quickly expanded to additional users and the team grew to support continual product improvements.
As the team grew and the product evolved, so did my role:
When the project reached a stable state, USDS was able to successfully hand off this work to our partners at the CDC and the vendor we had hired to supplement the USDS team.
COVID-19 tests
Test sites
Hours saved *
Public health departments reported that data sent using SimpleReport was higher quality than other methods. Testing sites reported that SimpleReport was very easy to use and saved them as much as 3–5 minutes per test compared to previous methods.
“If I have a substitute nurse come in for two days and she knows nothing about entering results, within 2 minutes she’s trained and ready to go. We love it, and it’s easy. And in education we need stuff like this to be easy, because nothing else is.”
– School administrator
The free SimpleReport app that the CDC developed with the US Digital Service filled critical gaps in COVID case reporting in remote rural areas, in schools, and in the fishing and tourism industries [which] Alaska’s economy relies on. SimpleReport was a huge game changer, enabling the state to go from calls and faxes to an automated tool.
– Chief Medical Officer for the state of Alaska
* Users estimated that SimpleReport saved them 3–5 minutes per test reported compared to previous methods. At 7.5 million tests, that conservatively translates to 375,000 hours saved from manual reporting!